Photo Credit: Instagram
 0
 0
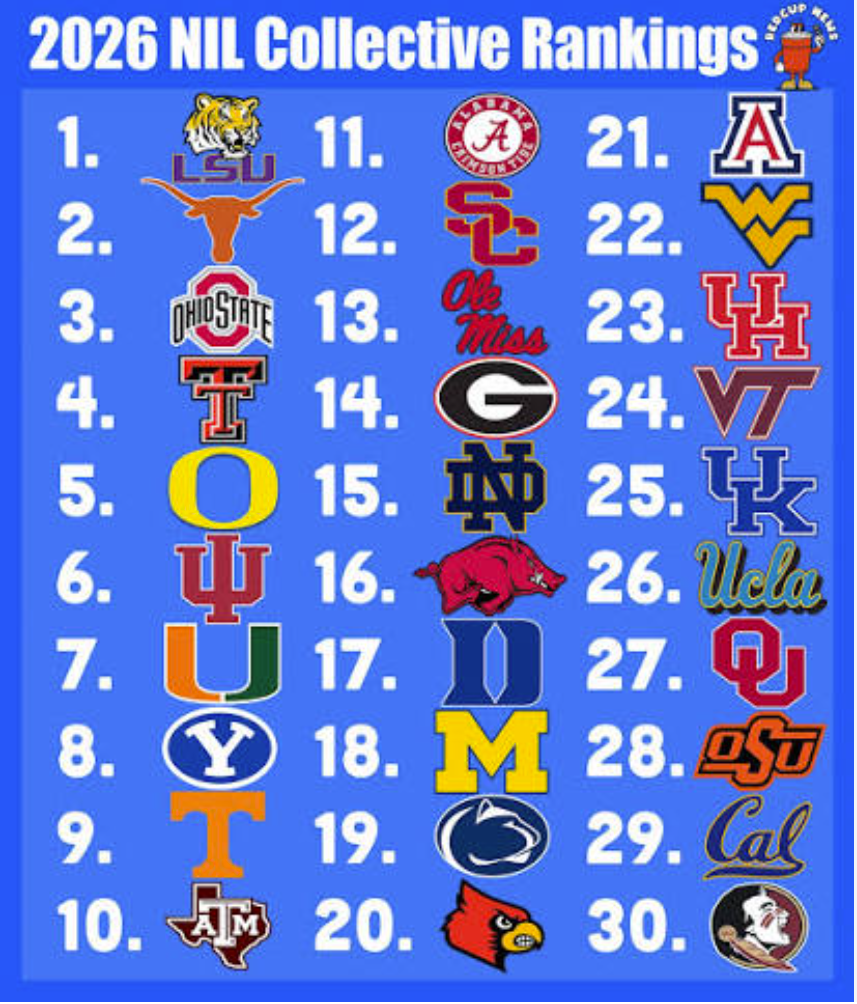
Money has changed college football forever. Championships still matter, but financial resources now shape nearly every major roster decision. College football programs compete for recruits, transfer portal stars, and established players with enormous financial commitments. Meanwhile, smaller programs struggle to match the spending power of traditional national contenders. The financial gap continues growing during the 2026 season. Some programs have assembled rosters worth approximately $50 million. Others operate with considerably less money.
However, one important distinction matters when comparing these figures. NIL valuations, actual NIL payments, and total football roster budgets represent different financial measurements. NIL compensates athletes for their name, image, and likeness. Revenue sharing allows schools to distribute athletic revenue directly to players. Consequently, the following rankings use estimated 2026 football roster budgets, including revenue sharing and program-supported NIL arrangements. These figures do not represent audited financial statements or every athlete’s independent endorsement earnings. A September 2026 investigation by The Athletic consulted more than 70 college football industry sources. Its research estimated roster budgets across 68 Power Four programs and Notre Dame. The rankings below use the reported budget ranges and their midpoints for comparisons. Overlapping ranges mean schools could occupy different positions in actual spending.
The 25 Highest College Football Roster Budgets in 2026
Ranked by estimated budget midpoint. All figures in millions of dollars.
| Rank | College football program | Estimated budget |
| —- | ————————- | —————- |
| 1 | Ohio State Buckeyes | $49–54M |
| 2 | Oregon Ducks | $48–54M |
| 3 | Texas Longhorns | $45–55M |
| 4 | LSU Tigers | $47–50M |
| 5 | Texas A&M Aggies | $45–50M |
| 6 | Miami Hurricanes | $44–50M |
| 7 | Notre Dame Fighting Irish | $41–48M |
| T-8 | Ole Miss Rebels | $39–45M |
| T-8 | Tennessee Volunteers | $41–43M |
| T-10 | Alabama Crimson Tide | $38–42M |
| T-10 | Texas Tech Red Raiders | $38–42M |
| 12 | USC Trojans | $37–40M |
| T-13 | Indiana Hoosiers | $36–40M |
| T-13 | Michigan Wolverines | $36–40M |
| 15 | Florida Gators | $31–41M |
| 16 | South Carolina Gamecocks | $32–35M |
| T-17 | Auburn Tigers | $31–35M |
| T-17 | Nebraska Cornhuskers | $31–35M |
| 19 | Georgia Bulldogs | $31–34M |
| 20 | Oklahoma Sooners | $28–34M |
| T-21 | Clemson Tigers | $29–32M |
| T-21 | Penn State Nittany Lions | $29–32M |
| 23 | Wisconsin Badgers | $27–31M |
| 24 | Missouri Tigers | $27–30M |
| 25 | UCLA Bruins | $26–30M |
Source: The Athletic’s September 16, 2026 estimates, as reported by On3 and compiled by All BIG Analytics.
Which Programs Have the Biggest Financial Advantage?
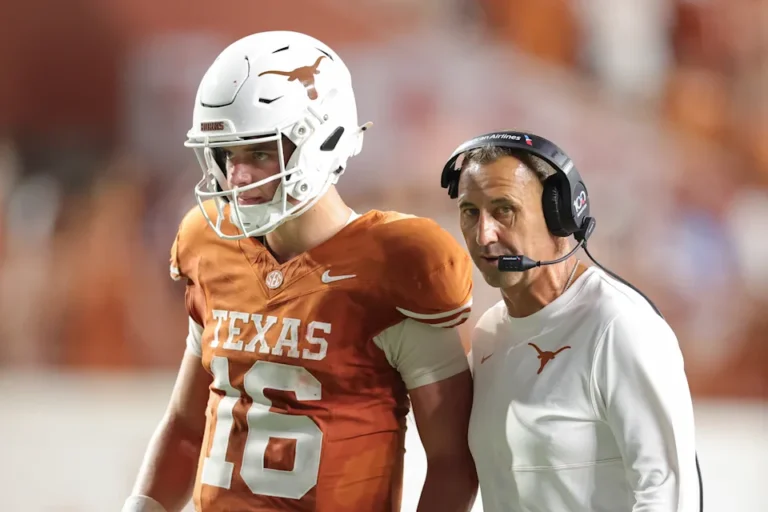
Ohio State leads the rankings with an estimated $51.5 million midpoint. Oregon follows closely at $51 million, while Texas sits at $50 million. These three programs have established themselves among college football’s financial heavyweights. Ohio State continues investing heavily in elite talent, including standout receiver Jeremiah Smith. Meanwhile, Oregon benefits from substantial financial support and a strong recruiting operation. Texas also maintains tremendous resources. Quarterback Arch Manning and a talented supporting cast help explain the Longhorns’ enormous roster investment. Furthermore, LSU, Texas A&M, and Miami have entered the same financial neighborhood. LSU invested aggressively in its roster following Lane Kiffin’s arrival. Miami pursued elite transfer talent, including quarterback Darian Mensah. However, spending more money does not automatically produce additional victories. Coaching, development, injuries, and roster chemistry remain essential ingredients. These schools possess advantages, but they still must deliver results on Saturdays.
The Middle of the Financial Race
Florida presents an interesting example of the changing financial landscape. The Gators carry an estimated roster budget between $31 million and $41 million. That places Florida 15th among the programs in the published top 25. Meanwhile, Georgia ranks 19th despite its championship pedigree. The Bulldogs’ estimated $31 million to $34 million budget demonstrates an important point. Strong recruiting and player development can help programs compete without leading the spending rankings. Indiana also stands out with a budget between $36 million and $40 million.
The Hoosiers have entered a financial category traditionally associated with established national powers. Additionally, Texas Tech represents the Big 12 among the country’s biggest spenders. The Red Raiders reportedly operate with a budget between $38 million and $42 million. That investment gives Texas Tech the financial resources to challenge programs from wealthier conferences. Nevertheless, money only creates opportunities. Programs must still identify the right players and build successful teams.
The Lowest Reported Power Four Football Budgets
The other end of the financial rankings reveals an entirely different reality. These nine programs occupy the bottom of the reported Power Four budget estimates. The table starts with the highest budget midpoint and moves toward the lowest.
| Program | Estimated budget |
| ———————- | —————- |
| UCF Knights | $15–20M |
| Houston Cougars | $15–19M |
| Oklahoma State Cowboys | $15–19M |
| Kansas Jayhawks | $15–17M |
| Arizona Wildcats | $13–18M |
| Iowa State Cyclones | $13–17M |
| Cincinnati Bearcats | $14–16M |
| Duke Blue Devils | $12–16M |
| Boston College Eagles | $8–13M |
Source: September 2026 reporting on The Athletic’s Power Four estimates. These are not necessarily the nine lowest budgets across all FBS programs.
Boston College occupies the bottom position with an estimated $8 million to $13 million. That represents an enormous difference compared with Ohio State’s estimated $49 million to $54 million. At their respective midpoints, Ohio State holds approximately $41 million more in roster resources. Duke also faces considerable financial limitations. Its estimated budget falls between $12 million and $16 million. Meanwhile, Cincinnati, Iowa State, and Arizona must compete against conference opponents with substantially greater financial resources. UCF presents another interesting situation. The Knights moved into the Big 12 after building a successful football program outside the Power Four. However, their estimated budget remains well below the conference’s biggest spender, Texas Tech. Houston and Oklahoma State face similar challenges. These programs must develop talent, recruit intelligently, and manage their rosters carefully. Otherwise, wealthier opponents can pursue their best players through the transfer portal.
What About USF and Other Group of Six Programs?
The financial situation becomes even more challenging outside the Power Four. Programs such as South Florida, Tulane, Memphis, and other American Conference members compete in a different financial environment. However, the available reporting does not establish a reliable, school-by-school 2026 ranking for every Group of Six program. Industry reporting places some of the wealthiest Group of Six football rosters around $10 million to $11 million. That figure remains considerably below the spending estimates for college football’s richest programs.
USF represents an important example of the challenges facing ambitious programs outside the Power Four. The Bulls must compete for talent against schools offering considerably larger financial packages. Additionally, maintaining successful rosters requires retaining productive players who attract attention from wealthier programs. That makes fundraising, recruiting relationships, and player development increasingly important. However, no sufficiently verified public figure establishes USF’s exact 2026 football roster budget. Assigning the Bulls a specific national NIL ranking would create a misleading comparison.
Does NIL Money Buy College Football Championships?
Money certainly improves a program’s chances of attracting talented players. However, the relationship between roster spending and victories remains complicated. A program can assemble an expensive roster without developing the chemistry necessary for championship football. Meanwhile, another school can maximize its resources through excellent coaching and player development. The early 2026 results illustrate that distinction. Georgia, Indiana, Missouri, and UCLA have demonstrated strong performance relative to their reported budget positions. Conversely, some programs with much larger financial commitments have struggled to match expectations.
An October analysis from All BIG Analytics found only a modest relationship between spending and national rankings. The financial competition also raises important questions about college football’s future. Can smaller programs consistently retain their best players? Will schools with limited resources eventually fall further behind? Could additional revenue sharing widen the gap between the Power Four and everyone else? Those questions deserve attention as college football continues evolving.
The Bottom Line
Ohio State, Oregon, and Texas lead the reported 2026 college football roster budget rankings. Meanwhile, Boston College occupies the bottom position among the 68 Power Four programs and Notre Dame. The difference between those financial extremes illustrates the sport’s growing economic divide. However, these estimates cannot establish the richest and poorest programs across every FBS conference. College football still rewards preparation, execution, and coaching. Yet financial resources increasingly determine which programs can attract and retain championship-caliber talent. The wealthiest schools can pursue expensive transfers while keeping established stars on campus.
Smaller programs must stretch every dollar and develop players who outperform their financial expectations. Ultimately, the biggest challenge involves maintaining meaningful competition across college football. The sport thrives when unexpected contenders emerge and established powers face genuine challenges. If financial disparities continue expanding, those opportunities could become increasingly difficult to sustain. College football has always featured programs with different resources. The NIL and revenue-sharing era has made those differences far more visible. And while money cannot guarantee a national championship, it certainly changes the odds.



Author Profile

-
Bradley Walker (VP) and Head of our Florida operations for NGSC Sports, bringing extensive experience across collegiate, professional, and amateur athletics. His coverage spans USF Athletics, including football, baseball, lacrosse, and softball, as well as University of Tampa baseball.
Bradley also provides coverage of minor league baseball with the Clearwater Threshers and Major League Baseball with the Tampa Bay Rays. On the national stage, he covers college football bowl games and conference championship matchups, along with premier golf events across the PGA Tour, LIV Golf, and LPGA Tour.
In addition to his reporting work, Bradley is the play-by-play announcer for Pinellas Park High School Patriots football, lending his voice and insight to Friday night lights.
He is also an active podcast host and contributor, serving as a host on The Walker Report, where he delivers in-depth sports analysis, interviews, and coverage across multiple levels of competition.
Latest entries
 FootballOctober 24, 2026Flagged Out! NFL’s 2026 Penalty Problem Has Fans Furious
 BasketballOctober 24, 2026College Basketball Hot Seat: 15 Coaches Facing Major Pressure in 2026-27
 FootballOctober 24, 2026College Football NIL Rankings 2026: Who Spends the Most and Least?
 FootballOctober 23, 2026NFL Week 7: Curveballs and Bold Predictions
About the Author